You may ask yourself, Why Visualisation? Well…Let’s see; your working day has begun. Today, however, is no ordinary working day. Today is the day you begin work accessing your facility data in a completely different way. The day your facility transforms from good to great.
To hand, you have a wealth of data from your new sensors and software platforms. This data helps you understand how everything is running and decide what needs to be actioned on a day-to-day basis. Great, right? The safety of your colleagues and the operational integrity of your facility and equipment are also your responsibility. So, where do you start?
The realisation has come to many that the digitisation of data and processes saves more time and money than ever. Companies are taking the time to select the best ways to do this, which often means implementing various applications and technologies.
Companies often feel the best way to accomplish this without affecting their operations is to tackle this in smaller projects focusing on particular processes or areas. This is a good idea, in theory.
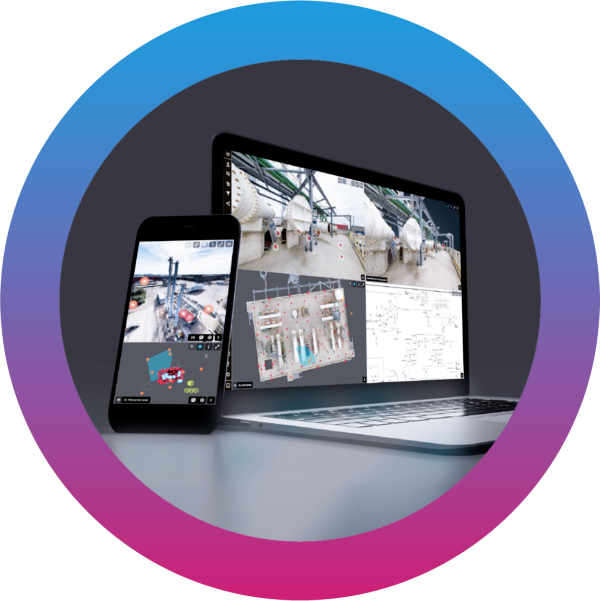
However, this can lead to companies having an abundance of Operational Technologies but no way of pulling that information together. Sound familiar? How many systems and spreadsheets do you open when you start your day? How many do you refer to before you can answer whether work can go ahead? And how much time could you save by the data all being easily accessible in one platform?
It is essential to integrate these separate systems and data feeds safely and quickly. This can be accomplished in many ways, including visualisation. A question often asked is, what are the benefits of implementing visualisation software above other data integration hubs?
Faster Processing
Neurotypically, visual material and information are processed by the brain 60,000 times faster than text. This faster intake and analysis allows for quicker intervention. If you can process critical data faster, you’ll also be able to respond to real-time circumstances much more efficiently.
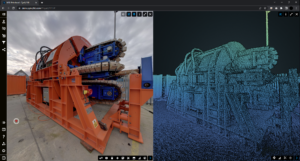
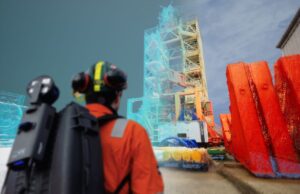
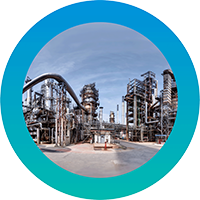
When you add visualisation to the process, it can increase this further by digitally immersing the user in the environment ahead of time. With visualisation as part of your processes, you can also use the data to make more preventative decisions by adding visual context to your operational data.
Reveal Hidden Concerns
The more people who have access to your operational data, the higher its value. Observations and patterns are uncovered that would otherwise go unnoticed. This allows you to plan and negate potential downtime within your facility. Employees will use the data to enhance their performance or processes, which can be extremely useful in any business setting.
Increased Productivity
Taking data and making it more readable at a glance will help most people be more productive, increase efficiency, and simplify daily tasks. Even better, users can analyse the data to reveal areas that need to be addressed quickly. This allows for faster response times and more consistent working practices.
Better Collaboration
Visualisation as a means of bringing your various data sources together also allows you to bring people together, including those who may not be able to visit your facilities, as the working world shifts to working remotely. This means that more people can participate in the analytical processes and, more importantly, that the right people for the job can participate in the solution.
Additional Applications
In addition, visualisation of your facility can be extremely useful in everyday operations, familiarisation, and scenario training. Absorbing new or complex information and retaining this in our long-term memory can be challenging, especially for new employees. Therefore, adding a visualisation that mirrors the working environment can help shorten the onboarding process of a new employee and make them feel more comfortable with the facility ahead of time.
Conclusion
Visualisation is a powerful tool for collating all your business data in a way that is easily understood and actioned by your team, resulting in reduced downtime, increased productivity, and increased profitability.
To find out more about ZynQ 360, visit our website here.
To watch a short video introducing our Digital Twin software, click here.

